 Wildflower Search Observation Time Plot
About the Observation Time Plots
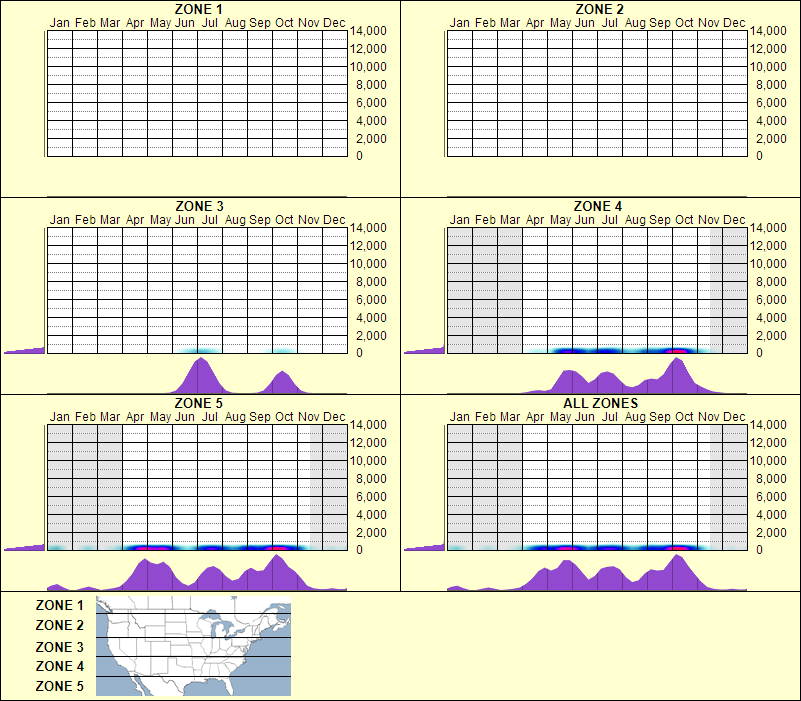
These plots show the elevations and times of year where the plant Paspalum praecox has been observed.
The first set of plots to look at is the "All Zones" set. This plot includes data from all latitudes. Each set contains three plots. On the left is an elevation plot. The elevation plot shows how often the species was observed at different elevations. The elevations go from 0 to 14,000 feet. At the bottom is a plot that shows when the species was observed. The large plot shows both when and at what elevation the species was observed. White areas indicate that the species was not observed at these elevations and times. As the species was observed more often the color changes from light cyan to blue and then to red.
In addition to the All Zones set there are five latitude zone sets. The time and elevation at which a species is observed sometimes different at different latitudes. Zone 1 is the most northern zone and zone 5 is the most southern zone. When the species is not found within a latitude zone the plots are blank. When a species is rarely found within a zone the plots may have so little data that they are not accurate. When there is little data the color of the large plot does not become red.
Observation Time Plot License
These plots use data from many sources listed at this Attribution and Copyright link. The plots are licensed under a Creative Commons Attribution-NonCommercial-ShareAlike license.